Verifying Cell-Based Assays for Use with 3D Models
Maggie Bach and Dan Lazar
Promega Corporation
Publication Date: December 2019
Introduction
As researchers increasingly adopt 3D cell culture systems to study disease and cellular model systems, assays originally intended for use with monolayer cell cultures need to be adapted to more complex 3D systems. While the use of these models provides advantages, such as increased physiological relevance to in vivo tissues, they also present challenges for researchers.
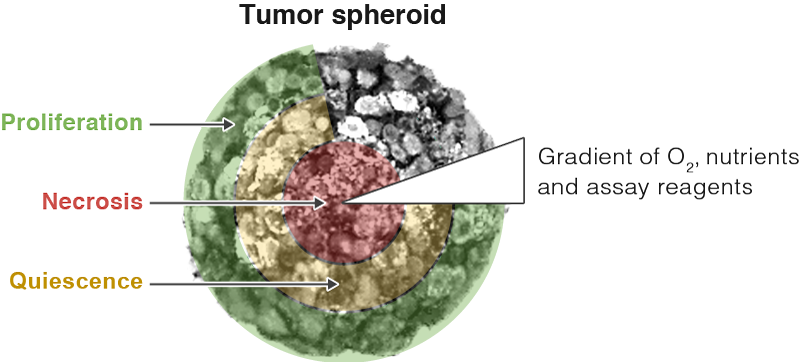
A key feature of 3D models that is both an advantage and challenge is heterogeneity within the model. The nutrient and oxygen gradients present in a 3D model are very different from the consistent nutrients and oxygen levels available to cells grown in monolayer. These gradients impact cell growth in a 3D model, causing cells in the center of a 3D model to be necrotic or quiescent, while cells on the outer layer of the spheroid continue to proliferate. Each cell model will be different depending on the size, cell types and technique used to form the structure. This heterogeneity helps researchers better model in vivo tissues. However, the different cell populations and 3D structures present challenges when analyzing how cells in a 3D model respond to treatment.
As researchers have increasingly used 3D cell culture models, they have adapted the assays or techniques used to interrogate the 3D models. In a monolayer cell-based assay, the assay reagents need to penetrate a single layer of cells or detect a marker secreted from the monolayer of cells to the culture medium. As you can imagine, it is much harder to penetrate a 3D cell structure or ensure that a marker secreted from a 3D structure is released into the culture medium and available to be detected. Assays that are adapted from monolayer cell culture to 3D cell culture need to be verified to ensure they are effective. Otherwise, how will you know whether the results are an artifact of the 3D culture system, or a true measure of the cell biology? Here we present two cases in which cell-based assays originally designed for monolayer cell culture were verified to give reliable results with 3D model systems. This verification helps researchers trust the data they are generating with 3D models.
Case #1: ATP Viability Assay—CellTiter-Glo® 3D
Assay Overview
The CellTiter-Glo® Cell Viability Assay detects live cells by quantitating the amount of ATP present in living cells. The reagent quickly lyses the cells, stabilizes the ATP present, and generates a luminescent signal proportional to the amount of ATP present. The signal is directly proportional to the number of living cells in the sample.
Challenge
3D structures are much larger with additional extracellular matrix proteins compared to cells grown in monolayer culture. Does CellTiter-Glo® reagent completely lyse the 3D structures and measure all the ATP present in the 3D structures?
Adaptation for 3D models
- Reformulated reagent. Promega scientists adapted the reagent formulation by increasing its lytic capacity, and a new CellTiter-Glo® 3D is now available for researchers to use specifically with 3D models. Increased detergent in the reagent ensures that it can lyse 3D structures up to 500μM. The Ultra-Glo™ Luciferase in the reagent is highly stable compared to native firefly luciferase, and can withstand the increased detergent formulation without a significant impact on activity or stability.
- Protocol updates. The new protocol for CellTiter-Glo® 3D includes increased shaking time compared to the original CellTiter-Glo® Assay. This increased shaking time helps physically disrupt the 3D structures.
Verification
Research and development scientists extensively verified performance of the reformulated reagent, along with the optimized protocol using multiple 3D models and orthogonal techniques to measure cell number and ATP recovery. We tested HCT116 colon cancer spheroids formed using the hanging drop method and additional cell types, including HEK293 embryonic kidney cells and HepG2 liver carcinoma cells. Orthogonal techniques to answer the question of complete cell lysis included measuring cell death after reagent addition and extracting ATP with acid.
R&D scientists first looked under the microscope at the 3D structures after adding CellTiter-Glo® 3D (a good habit for cell biology researchers). From the images, it looked like the 3D structures were still present even after adding the reagent and additional shaking. This might surprise scientists used to looking at lysed monolayer cells. However, the seemingly intact structure simply means that the extracellular matrix present around the cells was not broken up by the lytic reagent—not that cell lysis was ineffective. Therefore, verification of cell lysis would have to be done with a technique other than simple visual observation of the structure.

Figure 2. Spheroids were formed using HCT116 cells grown in hanging drop plates for 4 days. Cells were imaged before and after CellTiter-Glo® 3D Assay performance. Cells were mixed for 10 minutes at 600rpm, followed by 20 minutes of incubation.
A reagent that helped verify cell lysis both visually and quantitatively is the fluorogenic DNA binding dye used in the CellTox™ Green Cytotoxicity Assay. This reagent cannot penetrate cells with an intact membrane (viable cells), and when it enters dead cells with a compromised membrane, it binds to DNA and fluoresces. The fluorescent signal from dead cells can be visualized with a fluorescent microscope or quantitated with a plate reader. R&D scientists used both applications to show that addition of CellTiter-Glo® 3D reagent was indeed lysing cells. In Figure 3 below, green fluorescent signal from the majority of the spheroid visually confirmed new full-thickness lysis of cells in the sample. Indeed, volumetric calculations indicate ~97% lysis of the 3D spheroid model.

Figure 3. Lytic capacity of CellTiter-Glo® 3D verification.
HCT116 colon cancer spheroids were generated by seeding cells in the InSphero
GravityPLUS™ 96-well hanging drop platform and grown for 4 days. A 2X
concentration of CellTox™ Green Dye was added to the sample before addition
of CellTiter-Glo® 3D. After 5 minutes of shaking, the confocal laser
fluorescent microsopy images were acquired at 30 minutes using Ex/Em:
488/520nm. The spheroid is approximately 300μm in diameter.
This orthogonal measure was further used to verify a consistent relationship between the signal from CellTiter-Glo® 3D reagent and spheroid size. The relationship between Day 4 ATP levels (CellTiter-Glo® 3D signal) and seeding cell number on Day 0 is not linear (Figure 4, Panel A). This is due to several factors, including increased contact inhibition of cell growth with increasing spheroid size, impacts from nutrient and oxygen gradients, and even necrotic (dead) cells in the core of the larger spheroids. However, the DNA binding dye was again useful to demonstrate a linear relationship between two measures of cell number: 1) luminescence from viable cells assayed with CellTiter-Glo® 3D, and 2) fluorescence from the resultant lysed cells (CellTox™ Green).
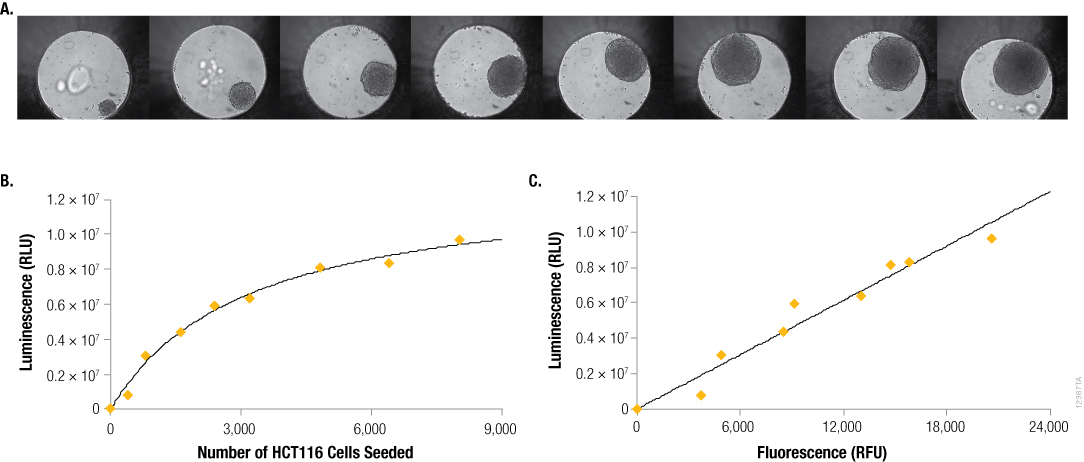
Figure 4. Seeding density vs. size, ATP content and DNA content. Panel A. Differential contrast images of HCT116 colon cancer spheroids grown for 4 days in the InSphero GravityPLUS™ 96-well hanging drop platform after seeding with 400, 800, 1600, 2400, 3200, 4800, 6400 or 8000 cells. Images were acquired in an InSphero GravityTRAP™ plate. Panels B and C. An equivalent volume of CellTiter-Glo® 3D reagent was added to all samples, and after 5 minutes of shaking, luminescence and/or fluorescence was recorded at 30 minutes. In Panel C, a 2X concentration of CellTox™ Green Dye was added to the CellTiter-Glo® 3D reagent prior to sample addition.
The assays outlined here are just a snapshot of all the orthogonal measurements and verification studies that went into developing CellTiter-Glo® 3D. For additional details on the experiments introduced here, see an introduction of CellTiter-Glo® 3D.
Case #2: Reporter Assay—Autophagy LC3 HiBiT Reporter
Assay Overview
Reporter assays introduce a reporter gene into cells and detect the product of the reporter gene when the gene is transcribed and translated by the cell. The reporter can include a protein tag or an enzyme such as luciferase. In this example, the LC3 protein, widely used as a marker of autophagic activity, is tagged with HiBiT, a small 11a.a. peptide tag. Cells expressing the Autophagy LC3 HiBiT Reporter are treated with inducers or inhibitors of autophagy. At the end of the experiment, cells are lysed and total LC3 is quantitated by adding the NanoGlo® HiBiT Lytic Detection Reagent, which includes the complementing LgBiT protein and NanoLuc® substrate.
Challenge
The Autophagy LC3 HiBiT Reporter was introduced into HEK293 cells, and the reporter cells were grown in both monolayer and 3D spheroids. Does the LC3 HiBiT Reporter signal accurately reflect reporter levels in 3D spheroids?
Adaptation for 3D Models
In this assay, to detect and quantify the tagged protein, the cells must be fully lysed to recover the tagged protein from all the cells. In order to facilitate lysis of the 3D spheroids, the protocol was adapted to increase the shaking time and reagent processing time after addition of the lytic reagent. The 2-minute shaking plus 10-minute incubation for monolayers was increased to 30 minutes of spheroid shaking and incubation.
Verification
The performance of the Autophagy LC3 HiBiT Reporter Assay System in 3D models was verified by comparing the recovery of the reporter to the ATP content in the spheroid model, wherein ATP is a useful surrogate for cell number. Different size spheroids were created from the HEK293 reporter cells by seeding increasing cell number in Corning® Ultra-Low Attachment 96-well plates. After 4 days of culture, spheroids of a wide range of sizes were generated for subsequent assay of autophagy reporter levels with the NanoGlo® HiBiT Lytic Detection Reagent. In parallel plates, a similar set of spheroids was processed with CellTiter-Glo® 3D to determine ATP content.

Figure 5. Reporter recovery from HEK293 spheroids. Spheroids were generated by seeding varying amounts of HEK293 reporter cells in Corning® Ultra-Low Attachment plates for 4 days. After 4 days, parallel spheroids were processed with either CellTiter-Glo® 3D or the Nano-Glo® HiBiT Lytic Detection Reagent, using a modified protocol of 30 minutes shaking and incubation.
To determine the relationship between reporter and ATP levels, the signals from the two assays were plotted against each other (Figure 5). The relationship between the two assays is linear, meaning that increases in ATP levels (i.e., increases in Day 4 cell number) correlate with a proportional increase in detectable autophagy reporter levels. These results verify the quantitative recovery and reporter detection by the Nano-Glo® HiBiT Lytic Detection Reagent, with the extended shake time, when applied to Autophagy LC3 HiBiT Reporter cell spheroids.
Once the autophagy reporter assay with increased shake time was verified to perform effectively in 3D cell spheroids, the assay system could be reliably used to evaluate autophagic activity in treated cell spheroids. Will cells grown in a 3D model respond differently to inhibitors or stimulators of autophagy compared to cells grown in a monolayer? In Figure 6, the three particular compounds tested in HEK293 Autophagy LC3 HiBiT Reporter cells behaved similarly in monolayer vs. spheroid culture models. The autophagy stimulator produced similar degradation of the autophagy reporter in both cell models, while both autophagy inhibitors prevented reporter degradation in monolayer and spheroid formats. Perhaps the most notable difference was an apparent decrease in bafilomycin A1 potency in spheroids as compared to monolayer cells.

Figure 6. Compound testing in 2D and 3D models. HEK293 Autophagy LC3 HiBiT Reporter cells were used to form spheroids (right) or grown in monolayer (left). Monolayer or spheroids were treated with increasing concentrations of a known autophagy stimulator (alone) or by increasing concentrations of two autophagy inhibitors in the presence of a fixed concentration of the autophagy stimulator. The resultant autophagy reporter levels were measured with the monolayer protocol or modified protocol for 3D structures. Results were normalized to luminescence of the untreated control for each sample type.
Conclusion
These two cases demonstrate two approaches for adapting assays for use with 3D models. With the increase of 3D model use and high demand for assays formulated for 3D models, more assays will be designed specifically to meet the needs of 3D cell cultures. When that isn’t possible, protocols for existing assays should be modified, and results should be compared to an assay extensively verified for use with multiple 3D models.
Related Resources
3D Culture & Assays Webinar
In this webinar, our experts answer common questions about 3D culture and assays.